Methods
Handwriter is a developmental R package hosted at github.com/CSAFE-ISU/handwriter. It is our major computational tool for the project. The package takes in scanned handwritten documents and the following are performed:
- Binarize - Turn the image into pure black and white
- Skeletonize - Reduce writing to a 1 pixel wide skeleton
- Break - Connected writing is decomposed into small manageable pieces called graphs with nodes and edges that usually repond to Roman letters.
- Measure - Measurements are taken on each graph
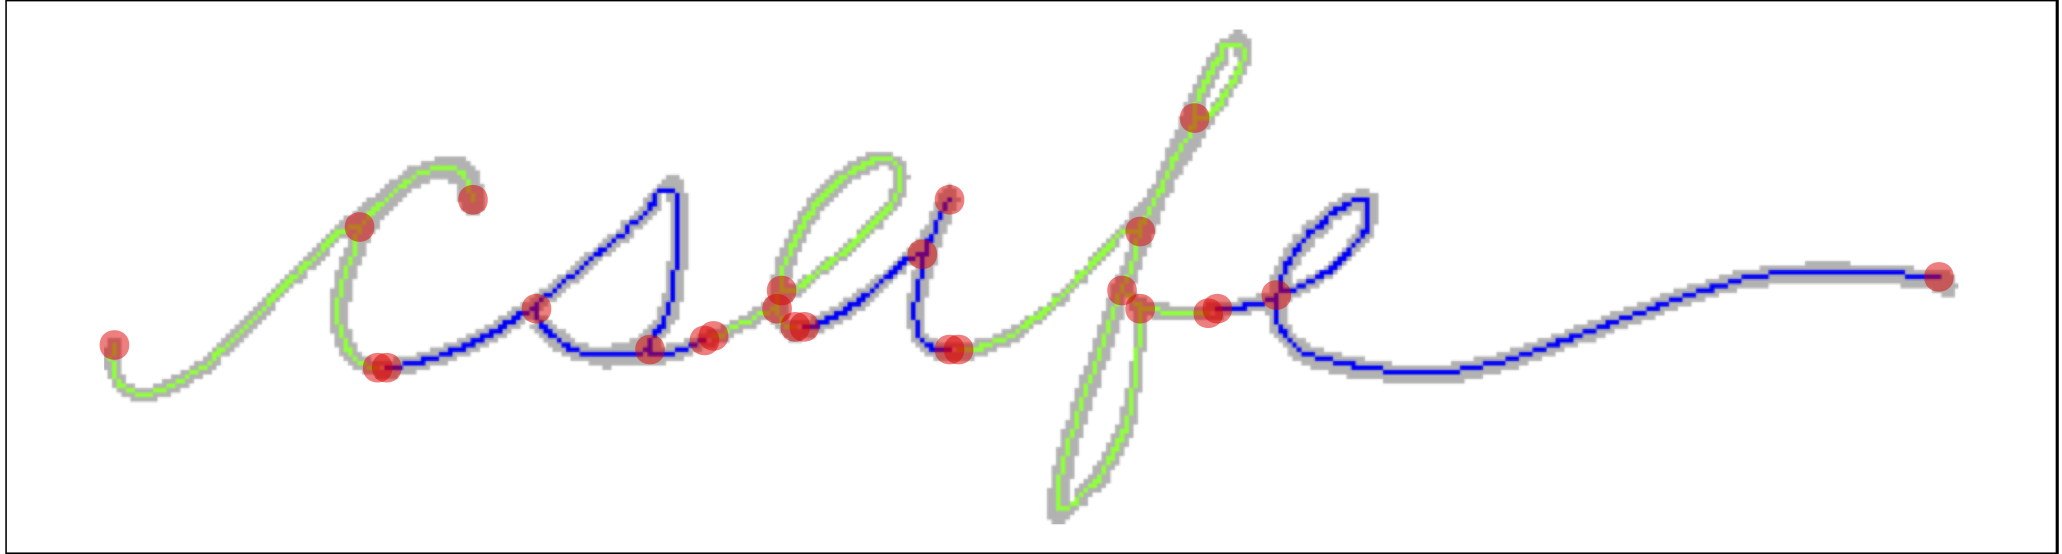
Below is an example we commonly use, the word 'csafe' in cursive. In this example you can see the gray background of the writing, a result of binarization. The colored lines is the single pixel skeleton. The change from green to blue marks the changes after the piece of writing is broken into graphs. The red dots are the endpoints and intersections of each graph.
From this point, measurements are taken on each graph individually. These measurements are calculated in Rcpp, a power package that allows for R functions to be implemented in C++. The measurements we looked at are Rotational Angle, Compactness, and Loops. Rotation Angle is by far the most useful measurement, but we feel all are worth mentioning.
Rotational Angle
The first principal component for each graph, or “letter”, is calculated through an eigendecomposition of the covariance matrix. The first principal component enjoys the property of having two invariant directions, and so we take the vector that lies in the upper half plane. The rotation angle of the graph is defined as the angle between the vector (0,1), and the unit principal component vector on the upper half plane. The angle is measured in radians and is considered a feature of the graph defined on the interval (0,π).
Let's walk through an example of how rotational angle can help differentiate between two writers.
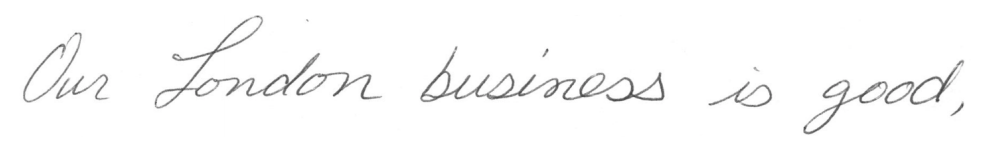
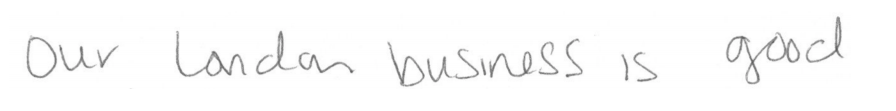
Here is the scanned writing of "Our London business is good," from our first writer, writer A:
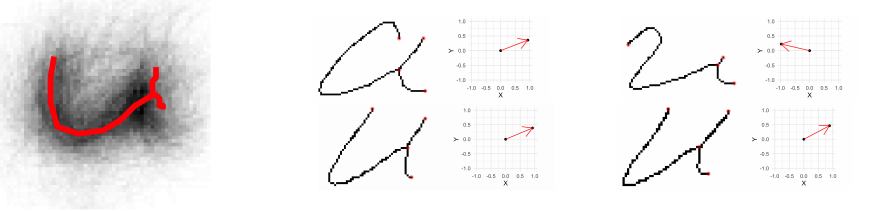
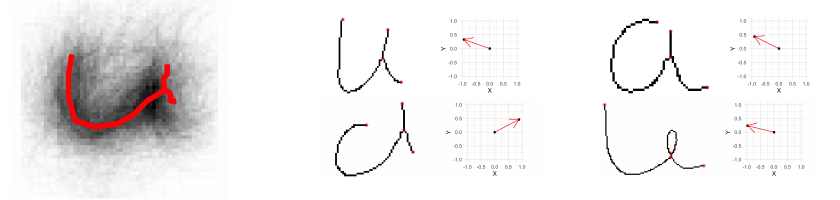
These measurements are used to differentiate inside of each cluster, so we will look at the cluster of graphs most similar to the letter 'u' in the roman alphabet.
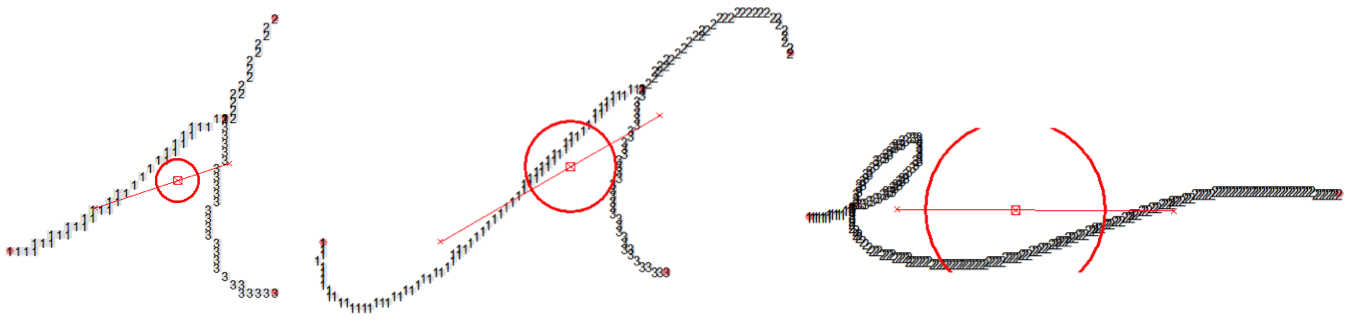
On the left is the cluster for this graph. On the right is 4 individual graphs from the writing, as well as a graph with each graphs direction of greatest variability.
Now, the directions determined above are compiled for each cluster from each writer. The compiled graph for the graph closed to the letter u from our writer A is shown on the left below. These data are then normalized to respect the polar coordinate system, and a curve is fit to approximate the distribuition of the rotation angle, show on the right
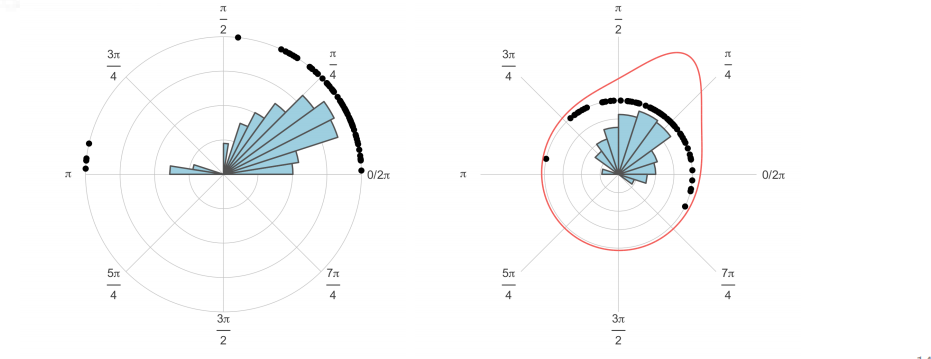
The same can be done for a writer B:
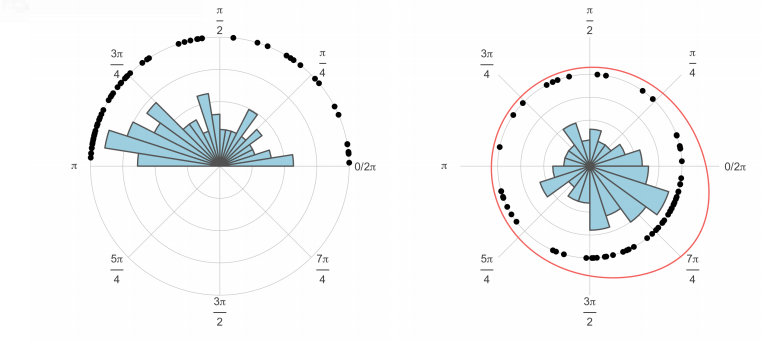
There is great disparity in the distribuition of the rotation angle between writer A and B when dealing with this cluster. We have found this measurement to be the most influential in correctly identifying a writer.
Compactness
Compactness is computed as:
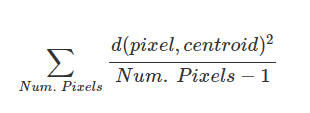
It can be thought of as the tightness of black pixels in each graph based on distance from the centroid
A compactness value is found, and can be plotted around the centroid as such:
Unfortunatley, while informative for comparing like-sized graphs, this measurement suffers from the inherently spatial dependence between pixels and (unfortunately) does not scale well for modelling.
Loops
The number of loops in a given graph is found, as well as the height to width ratio of each.
Unfortunatley, we found that most loops in handwriting are generally about the same shape, and didn't produce any useful information in differentiating between writers.
What's next?
Once each graph's measrurements have been taken and saved, the job of handwriter is done. You can now take this information and integrate it into your specific workflow.
For an example of our workflow that involved handwriter, take a look at Our Workflow