library(handwriter)
plot_credible_intervals(model = example_model)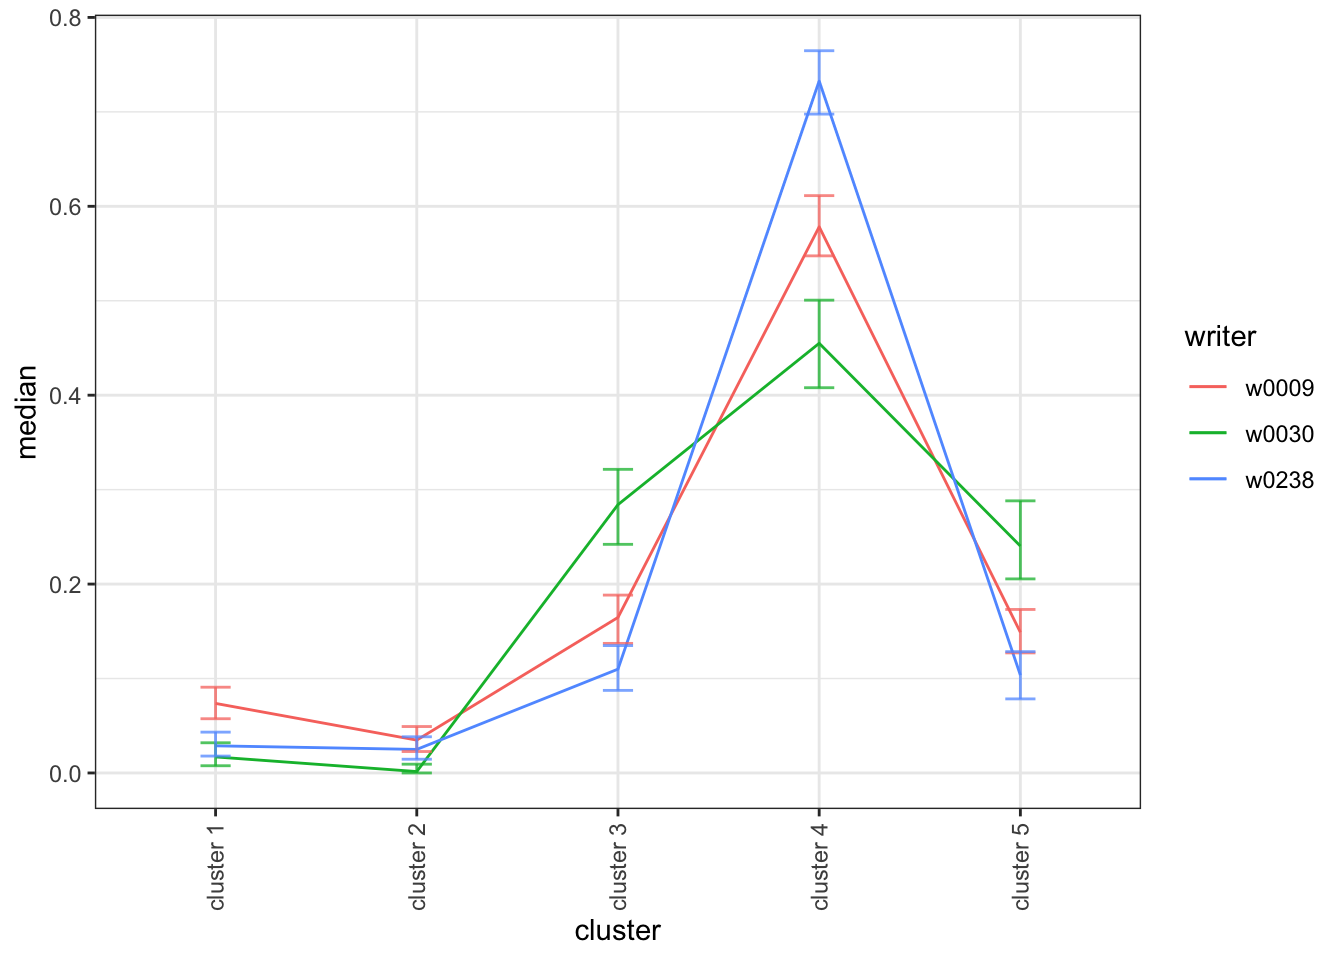
plot_credible_intervals(model = example_model, facet = TRUE)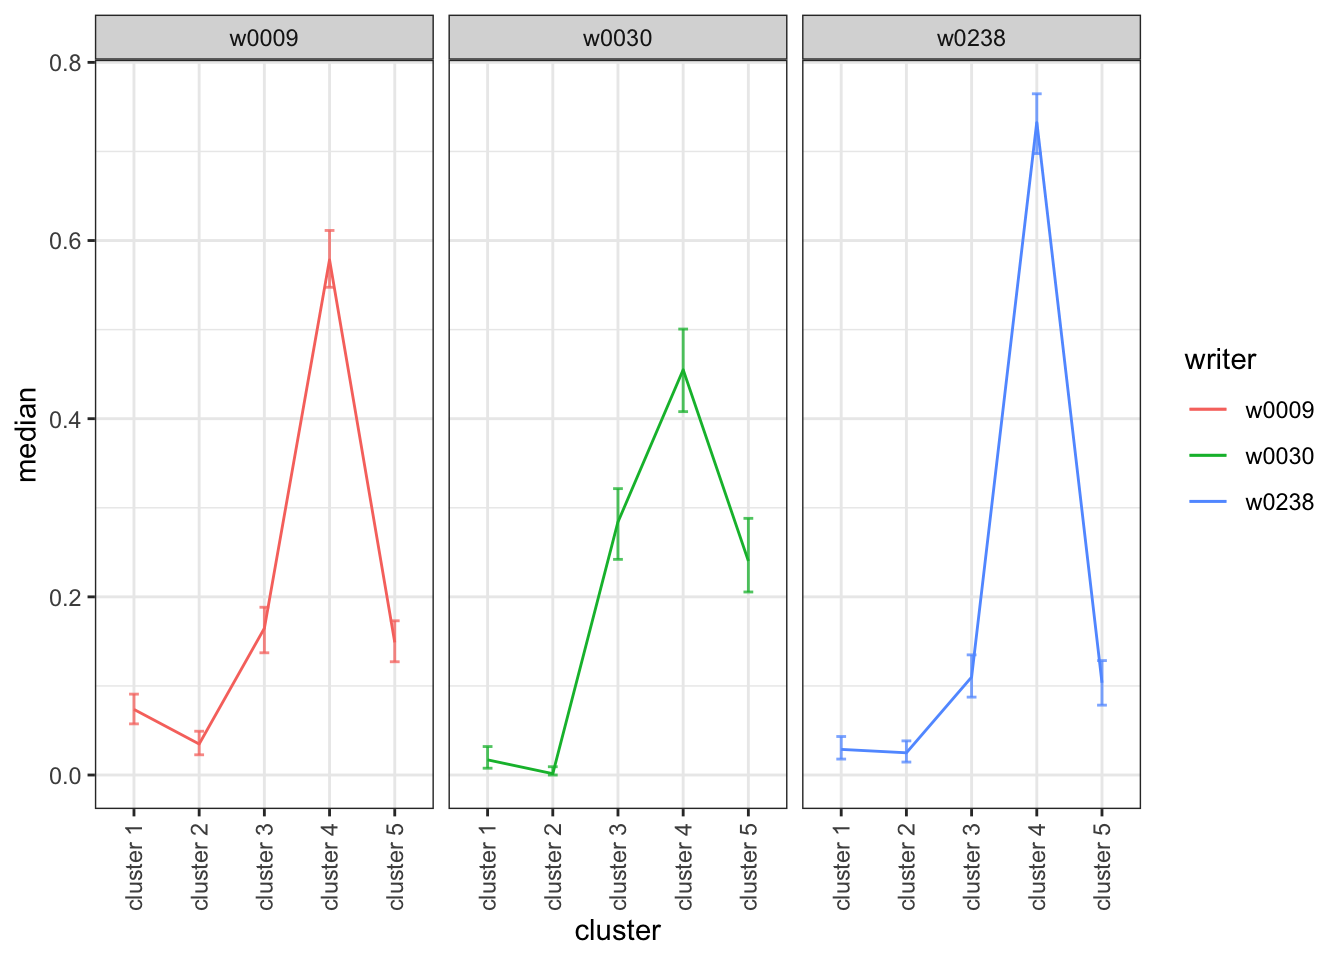
Plot credible intervals for the model’s pi parameters that estimate the true writer cluster fill counts.
plot_credible_intervals(
  model,
  interval_min = 0.025,
  interval_max = 0.975,
  facet = FALSE
)
model
|
A model created by fit_model()
|
interval_min
|
The lower bound of the credible interval. It must be greater than zero and less than 1. |
interval_max
|
The upper bound of the credible interval. It must be greater than the interval minimum and less than 1. |
facet
|
TRUE uses facet_wrap to create a subplot for each writer. FALSE plots the data on a single plot.
|
ggplot plot credible intervals
library(handwriter)

plot_credible_intervals(model = example_model)
plot_credible_intervals(model = example_model, facet = TRUE)