While we work on something interactive and web-based, you can download the package yourself and give it a try.
The following is a step by step tutorial to help you along the way.
Recently we have been incorporating our research work built on top of handwriter so that you may also use those.
See the Research Pipelines section for more.
Things you'll need:
The R software environment, downloadable from
The R Project.
You may use this mirror from Iowa State if you wish.
RStudio Desktop, an IDE that should simplify the experience.
A sample of handwriting in .png format, you can:
Write something up (black and white works best) and scan it digitally.
Use an online tool like
Sketch.io
create and export some handwriting easily.
Handwriter uses the RCPP package, an R package that allows RStudio to compile the C++ code in the handwriter program. When a Mac user runs handwriter, the machine will use its default C++ compiler called clang. This default will produce an error that says: "ld: warning: directory not found for option '-L/usr/local/gfortran/lib/gcc/x86_64-apple-darwin15/6.1.0'"
The following steps will help you to fix this issue:
If you have previously used clang4, clang6, clang7, clang8, or the macos-rtools, consider deleting the old components that
were installed. To do this, execute the following lines in the Terminal app:
# Delete the clang4,6,7 binary
sudo rm -rf /usr/local/clang{4,6,7}
# Delete the prior version of gfortran installed
sudo rm -rf /usr/local/gfortran
sudo rm -rf /usr/local/bin/gfortran
# Remove the gfortran install receipts (run after the above commands)
You will need to remove both the ~/.R/Makevars and ~/.Renviron files before continuing. You can do this by using:
unlink (“~/.R/Makevars”)
unlink (“~/.Renviron”)
Next, still in the Terminal, you will need to install the Xcode Command Line Tools or Xcode CLI. To do this execute: xcode-select --install
If you encounter an error while installing, the Xcode CLI might already be installed. This may mean that a software update of the tools is in order, execute the following line: softwareupdate --install -a.
After installing the Xcode CLI, you will need to install OS-specific GFortran Binary. To do this, you will first need to verify your macOS version.
Knowing what version of macOS your computer is running, you will then go to: GFortran-for-macOs-Repo. This link will direct you to a GitHub page that will contain installation packages containing GFortran binary for different macOS versions. After downloading the folder, open the GFortran folder inside and run the gfortran.pkg. This will prompt an installation window that will help you successfully install the binary.
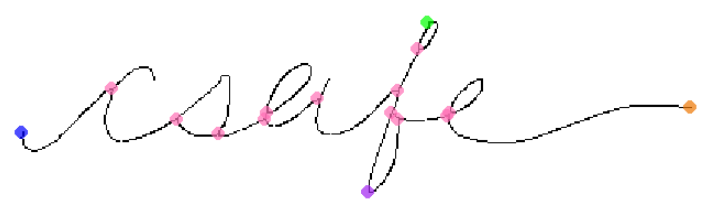
processHandwriting() will return tons of information about the document. It is worth exploring, and we've provided a handy list here of what each element of the list means
On a document level:
nodes | A list of all 'points of interest'
connectingNodes | A list of all nodes where graphs connect
terminalNodes | A list of all nodes where a path in a graphs ends
breakPoints | A list of calculated points to break graphs apart (based on connectingNodes)
As well as a letterList for each letter/graph that includes:
path | A list of all points
nodes | A list of all 'points of interest'
allPaths | A list of lists of calculated 'paths'
adjMatrix | Adjacency matrix
letterCode | A unique letter code
connectingNodes | A list of all nodes where the graph connects
terminalNodes | A list of all nodes where a path in the graph ends
characterFeatures | A list of all 'points of interest' in the document
aspect_ratio | Height to width ratio
height | Height of the graph, measured in pixels
width | Width of the graph, measured in pixels
topmost_row | The top-most row, as its y coordinate
bottom_row | The bottom-most row, as its y coordinate
leftmost_col | The left-most column, as its x coordinate
rightmost_col | The left-most column, as its x coordinate
centroid_index | The centroid of the graph, as its index
centroid_y | The y coordinate of the centroid
centroid_x | The x coordinate of the centroid
centroid_horiz_location |
centroid_vert_location |
lHalf | List of all points on the left half of the graph
rHalf | List of all points on the right half of the graph
disjoint_centroids | The centroids of the left and right halves, as their indicies
slope | The slope of the graph as it runs through the centroid
pixel_density |
box_density |
uniqueid | A unique numerical identifier for the graph
down_dist | Distance from the lowest point of a graph to the next graph, measured in pixels
line_number | The position of the graph in the line
order_within_line | The ordered within the line the graph falls in
l_neighbor_dist | Distance from the left-most point in the graph to its left neighbor, measured in pixels
r_neighbor_dist | Distance from the right-most point in the graph to its left neighbor, measured in pixels
xvar | Variance of X, used to calculate the covariance in covar
yvar | Variance of Y, used to calculate the covariance in covar
covar | Covarience of the graph
wordIndex | Word number the graph belongs to
Exploring processed writing
Using the information returned from processHandwriting(), Handwriter allows plotting on a letter (or graph), word, sentence, or the entire document.
Make sure to save this information so that the plotting functions work correctly
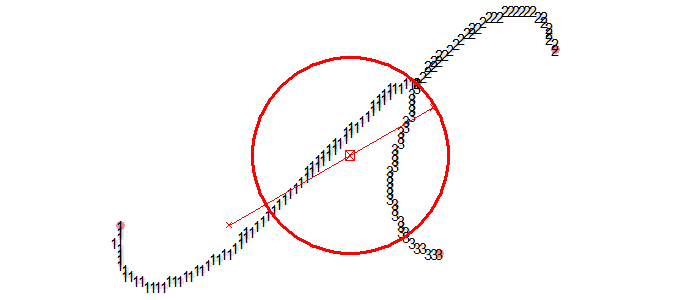
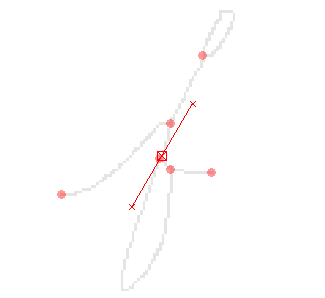
Also included is the ability to plot individual graphs from the sample of writing, using
plotLetter(). First lets look at the parameters and options, and then run through a few examples.
The parameters include:
letterList Object
The index of the graph you wish to plot
dims Object
OPTIONAL: Boolean - Number the paths within the graph
OPTIONAL: Boolean - Plot the centroid of the graph
OPTIONAL: Boolean - Plot the slope of the graph
The following will result in the first graph being plotted with all optional paramters:
                        plotLetter(csafe_processList$letterlist, 1, dims)

                          #Note: No optional parameters specified is the same as:
                          #plotLetter(csafe_processlist$letterList, 1, dims, TRUE, TRUE, TRUE)
This will plot the fifth graph with just the slope and centroid: